
Solar Energy Report
Solar Power Generation by State
Find out which U.S. states produce the most residential solar energy and which states get the highest percentage of their energy from clean sources.
Over the past decade, electricity prices across all states have gone up an average of 2.52% per year, but in 2022 they’re up 7.49%.
As energy prices surge globally, electric bills for U.S. homeowners have dramatically increased. This past August, 11 states were shocked by utility bills that were 20% higher than last summer.
With millions of Americans impacted by rising electricity and natural gas prices, we researched how much energy costs in each state and how much you could save by getting solar panels for your home. We also looked into which states produce the most electricity from clean energy technologies like windmills, hydroelectric, and solar panels.
Key U.S. Energy Facts

Hawaii has the most expensive cost of residential electricity, over 4X as much as the cheapest state for electricity, Idaho.

Energy prices are rising in every state, but nowhere are they rising as quickly as in California and Maine.

Getting solar panels could increase the value of the average home in the U.S. by at least $5,744.

In every state, it's possible to save money on your electric bills the first year you have a home solar system.

California is the biggest producer of residential solar power in the U.S.

Vermont produces almost 100% of its energy from clean sources.
Which states produce the most residential solar energy?
According to the Solar Energy Industries Association (SEIA), solar installation costs have declined by more than 60% over the past decade. This, among other factors — like the desire to run a home on clean energy or save money on electric bills — is driving solar adoption across the country. That said, some states are leading the charge (pun intended) when it comes to producing solar energy. We looked at which states produce the most energy from home solar installations.

California
Produces 39.3% of the residential solar energy in the U.S.
California is miles ahead of all other states in terms of residential solar energy production. In 2018, California mandated that all new single-family homes and multi-family dwellings up to three stories high must be built with solar panels. This came into effect in 2020, adding to the momentum of Californians' transition to solar energy.

New York
Produces 6.1% of the residential solar energy in the U.S.
Far behind frontrunner California, the state of New York is the second-highest producer of residential solar energy. In New York, local laws 92 and 94 mandate solar panels or green roofs be installed with all new home builds where cost-effective.

Arizona
Produces 5.9% of the residential solar energy in the U.S.
Arizona is the third largest producer of residential solar power in the US. The state is committed to producing 15% of its energy from renewable resources by 2025.
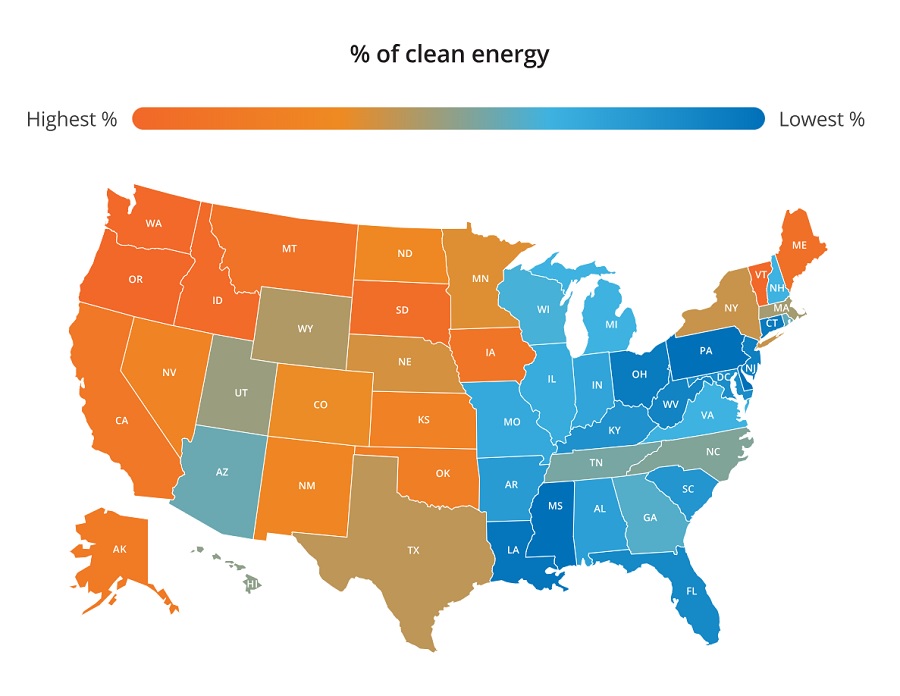
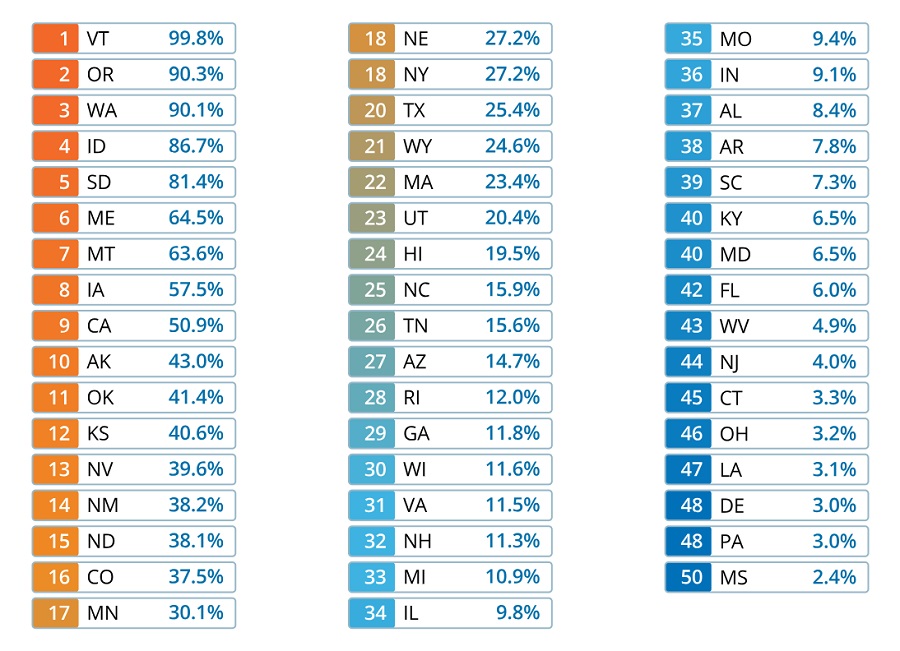
Which states get the highest percentage of their energy from clean sources?
In an effort to build a more sustainable future, many states are producing clean electricity from renewable sources. According to the U.S. Energy Information Administration, the states below get the highest percentage of their energy from renewable sources. Notably, all three rely heavily on hydropower.

Vermont
99.8% of the energy used in the state comes from renewables.
Vermont is leading the nation in terms of clean energy use with almost all of its energy comes from renewable sources. Over half (58%) of its power is hydroelectric, and Vermonters have the smallest energy consumption in the US.

Oregon
90.3% of the energy used in the state comes from renewables.
Oregon is another state getting most of its energy from renewable sources with 50% of all energy generated from hydropower.
Washington
90.1% of the energy used in the state comes from renewables.
Washington is the nation’s largest producer of hydropower, so it’s no surprise that it’s also one of the top consumers of clean energy.
Percentage of Clean Energy Generation by State
In which states do homeowners pay the most for electricity?
As energy prices surge globally, where you live impacts how much you pay for electricity. We wanted to find out which states have the highest electricity prices.
Each state has a different average cost of electricity in cents per kilowatt-hour (kWh). Kilowatt-hour is a measure of energy equalling one kilowatt of power for one hour. Living in the following states can lead to particularly high monthly electricity bills.
Hawaii
45.69¢/kWh
Cost of residential electricity
Hawaii is the most expensive state for electricity, with an average price of 45.69¢/kWh. Electricity in Hawaii is over 40% more expensive than it is in New Hampshire, the state with the second highest rates. Hawaii’s electricity is nearly 3X the price of electricity in the rest of the U.S. and rose by 38% since last year!
New Hampshire
32.32¢/kWh
Cost of residential electricity
New Hampshire has the second most expensive electricity in the country. Although the cost of residential electricity is approximately 13¢/kWh cheaper than in Hawaii, the New Hampshire average of 32.32¢/kWh is higher than all other states, exceeding the U.S. average by over 190%.
Connecticut
28.84¢/kWh
Cost of residential electricity
Connecticut is among the most expensive states for electricity with average energy prices of 28.84¢/kWh. Connecticut’s average electricity price per unit is over 170% more expensive than the U.S. average.
In which states do homeowners pay the least for electricity?
Homeowners in these states tend to have lower monthly electric bills.
Idaho
10.51¢/kWh
Cost of residential electricity
Electricity in Idaho is very affordable, coming in at an average price of 10.51¢/kWh. Despite electricity prices increasing by 25% since 2012, Idaho’s cost of electricity is still 46% less than the U.S. national average.
Washington
10.57¢/kWh
Cost of residential electricity
Ranking in second place is Washington which is one of the most affordable states when it comes to electricity in the U.S. With an average of 10.57¢/kWh, electricity in Washington is over 45% cheaper than the average of all states in the U.S.
Utah
11.50¢/kWh
Cost of residential electricity
Utahns have benefited from lower electricity bills than most other states. Utah’s average electricity price is over 37% cheaper than the average of all states. Over the past 10 years, the average cost of electricity has only increased by 0.78¢/kWh, but in the last year, prices increased by 0.54¢.
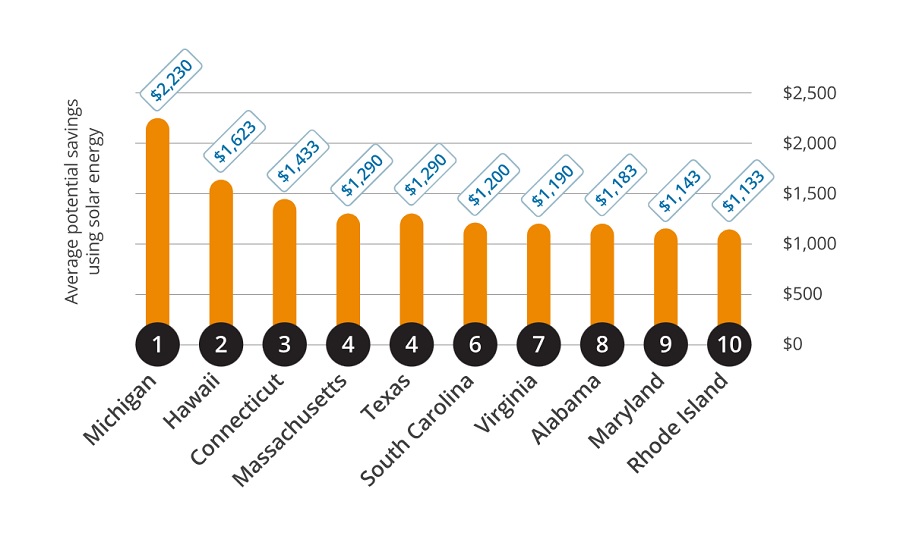
How much money could you save by using solar energy?
We used SunPower’s solar power calculator to determine the potential first-year electric bill savings from using a home solar system in each state.
To do this, we randomly selected three addresses, each with a varying shade level, and recorded the potential first-year electric bill savings when powering your home with 80% solar energy. We then calculated the average savings for each state. It’s important to note that the electric bill savings will likely increase each year.
How much could solar panels increase your home value?

Installing solar panels for your home is an investment, but it’s also an upgrade that can positively impact the value of your home. A solar-powered home often makes the property more attractive to potential buyers and helps you get a higher asking price. Rocket Mortgage reports that home listings with solar are 24.7% more likely to sell over ask and spend 13.3% less time on the market.
We found the average house price in each state from Zillow and used information from EcoWatch to find the amount by which solar panels increase home values. Powering your home with a solar system can add 4.1% to your home's value, making the average California home worth $807,687. The average home in New York is worth $408,833 and could be worth $425,595 once it has solar panels.

To get the best value on your solar system and increased property value, you need a solar system that's the right size for your energy use and has high-quality solar panels. A local solar installer can help you calculate the best way to maximize a solar system’s value for your home.
Methodology
This report was created by SunPower to help consumers understand the costs of electricity around the US, the usage and efficiencies in alternative energy sources, and the impact going solar could have on homeowners in cost savings and potential home valuations in different States.
We sourced the total average cost of residential electricity in cents/kWh as of September 2022 from the U.S. Energy Information Administration (EIA) Electric Power Monthly.
We calculated the predicted average price of residential electricity from 2023-2030 in cents/kWh by using the growth in the average price of electricity from 2012-2022, sourced from the U.S. Energy Information Administration Electric Power Monthly.
We sourced the percentage of energy produced from renewable sources from the U.S. Energy Information Administration Independent Statistics and Analysis using figures for the utility-scale net electricity generation (share of total).
We also sourced the percentage of energy produced from solar power from the U.S. Energy Information Administration Independent Statistics and Analysis, looking at utility-scale solar wind, geothermal net electricity generation and residential solar photovoltaic generation. States for which the relevant information was unavailable were removed.
We sourced the average home value for each state from Zillow. We then sourced the potential average home value with a home solar system from EcoWatch.
We calculated the average potential first-year electric bill savings using a home solar system using the SunPower Residential Solar Power Calculator. We used three randomly selected addresses for each state — one with no shade, one with a low shade level and one with a high shade level. For all addresses, we assumed no use of an electric vehicle and the use of solar energy for 80% of the residence’s power.
For each residence, we used the recommended number of 360W solar panels. We also used each state's average monthly electric bill rounded to the nearest 10, which we sourced from the U.S. Energy Information Administration. We then took an average of the potential savings across all three addresses to find the average potential first-year electric bill savings in each state.
Statistics on the declining cost of solar installation over the past decade were sourced from the Solar Energy Industries Association.